
library(tmap)
tmap_mode("plot")
data(NLD_prov)
tm_shape(NLD_prov) +
  tm_borders(lwd=2) +
  tm_fill("name") +
  tm_format("NLD", title="Dutch provinces", bg.color="white")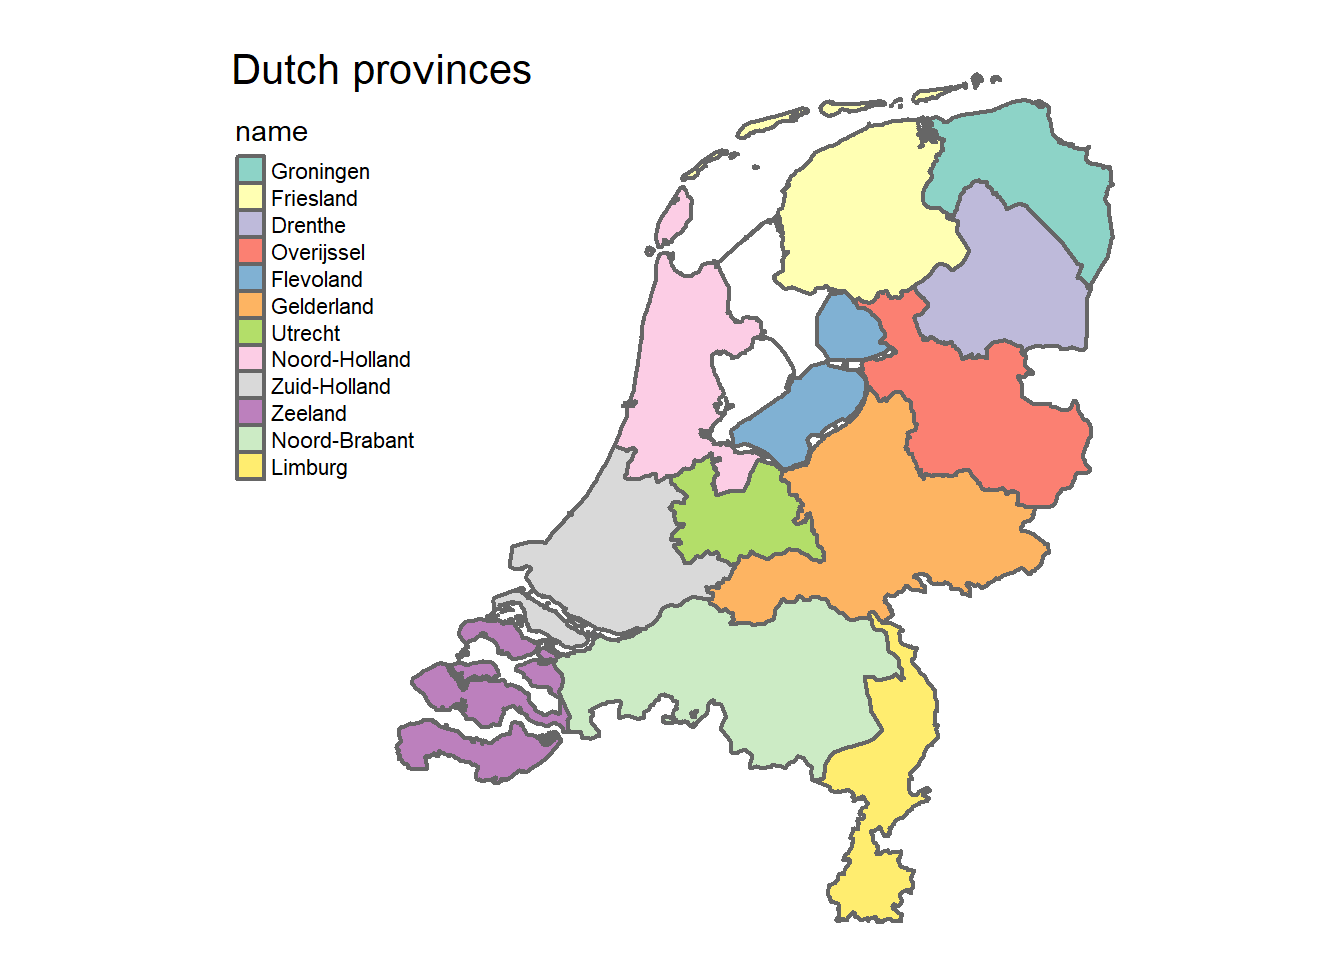
Hello folks, I hope everything is ok with you and that you had a nice summer break. As for me, I am still recovering from a quite sad period but I think that the best thing for me right now is to try to get back to my work, especially research which, I must confess, I have a bit neglected due to many reasons. While looking for some new ideas to work on, I thought that it could be fun to just simply do some simple coding and analysis to re-ignite my passion on the matter. To be fair, I feel that I am still ready to do lots of things but, due to time constraints and official academic duties, I am not engaged in my research in person since some time now.
So, my idea for today is to simply do some statistics! And then, why not researching something I am interested in? I think this would make the work so much easier for me, especially since I am looking for something different from what I have done so far. Then, allow me just for this time to change the topic of my work and try something quite different. To join pleasure and duty, I also thought to do some simple analyses that perhaps I could re-use in one of my introductory courses on statistics in some way.
Having said so, what am I going to do? let’s say that I am interested the Olympic medals that were won by the Netherlands in the last edition of the games, Paris 2024. Well, looking this up on the internet I found that the country won a total of \(34\) medals, of which \(15\) golds, \(7\) silvers, and \(12\) bronzes. Quite impressive for such a small country! Now, what I am really curious about is how the winners of these medals are spread around the country, that is were these athletes born evenly across the \(12\) provinces of the Netherlands? or perhaps there are some clusters of provinces that seem to be more “productive” in terms of Olympic medal winners? Well, let’s see how we can do this.
First, I will draw a map of the Netherlands on which I will show where the different provinces are located and how big they are:
library(tmap)
tmap_mode("plot")
data(NLD_prov)
tm_shape(NLD_prov) +
tm_borders(lwd=2) +
tm_fill("name") +
tm_format("NLD", title="Dutch provinces", bg.color="white")
Next, I will create a new dataframe which contains all the information used to draw the map related to each province, with in addition the information about how many medal winners were born in each of the provinces. Keep in mind that the number of “winners” will be effectively higher than the nominal number of “medals” won by the country since usually, when a team of athletes wins a medal in a team discipline, then the country is awarded a single medal but in reality multiple athletes won and therefore multiple medals were awarded. Since here I am interested in the spreading of the medal winners across the Dutch provinces, then I will consider each individual winner as a separate medal holder. Also, in case a medal winner wins more than one medal, I will count them as a different athlete for as many medals as they won.
More specifically, the Dutch team at the 2024 Paris Olympics won a total of 8 medals in the rowing discipline:
A total of 7 medals in cycling discipline:
A total of 6 medal in the athletics discipline:
A total of 4 medals in the sailing discipline:
A total of 3 medals in the swimming discipline:
A total of 2 medals in the Field hockey discipline:
1 gold medal in the Men’s tournament –> Seve van Ass (Zuid-Holland); Lars Balk (Utrecht); Koen Bijen (Zuid-Holland); Pirmin Blaak (Zuid-Holland); Justen Blok (Zuid-Holland); Thierry Brinkman (Utrecht); Jorrit Croon (Zuid-Holland); Thijs van Dam (Zuid-Holland); Jonas de Geus (Noord-Holland); Tjep Hoedemakers (Noord-Brabant); Jip Janssen (Noord-Holland); Floris Middendorp (Overijssel); Joep de Mol (Noord-Brabant); Tijmen Reyenga (Noord-Brabant); Duco Telgenkamp (Zuid-Holland); Derck de Vilder (Noord-Holland); Floris Wortelboer (Noord-Brabant)
1 gold medal in the Women’s tournament –> Felice Albers (Noord-Holland); Joosje Burg (Noord-Brabant); Pien Dicke (Zuid-Holland); Luna Fokke (Zuid-Holland); Yibbi Jansen (Noord-Brabant); Marleen Jochems (Noord-Brabant); Sanne Koolen (Gelderland); Renée van Laarhoven (Gelderland); Frédérique Matla (Noord-Holland); Freeke Moes (Noord-Brabant); Laura Nunnink (Noord-Brabant); Lisa Post (Noord-Brabant); Pien Sanders (Noord-Brabant); Marijn Veen (Utrecht); Anne Veenendaal (Noord-Holland); Maria Verschoor (Zuid-Holland); Xan de Waard (Gelderland)
A total of 1 medal in the Artistic swimming, Basketball, Equestrian, Water polo discipline:
Note that those athletes who were not born in one of the \(12\) provinces of the Netherlands are denoted with an \(^\star\) and are therefore excluded from the counting.
#"Groningen", "Friesland", "Drenthe", "Overijssel", "Flevoland", "Gelderland", "Utrecht", "Noord-Holland", "Zuid-Holland", "Zeeland", "Noord-Brabant", "Limburg"

NLD_prov_medals <- NLD_prov
NLD_prov_medals$Gold <- c(0,2,0,4,0,6,5,12,17,0,15,0)
NLD_prov_medals$Silver <- c(1,1,0,1,0,3,1,8,5,0,5,0)
NLD_prov_medals$Bronze <- c(0,0,1,0,0,5,3,5,5,0,3,0)
NLD_prov_medals$All <- c(1,3,1,5,0,14,9,25,27,0,23,0)

tm_shape(NLD_prov_medals) +
  tm_borders(lwd=2) +
  tm_fill("All", palette = "Greys") +
  tm_layout(
    legend.title.size = 1,
    legend.text.size = 0.6,
    legend.position = c(0,0.44),
    legend.bg.alpha = 1)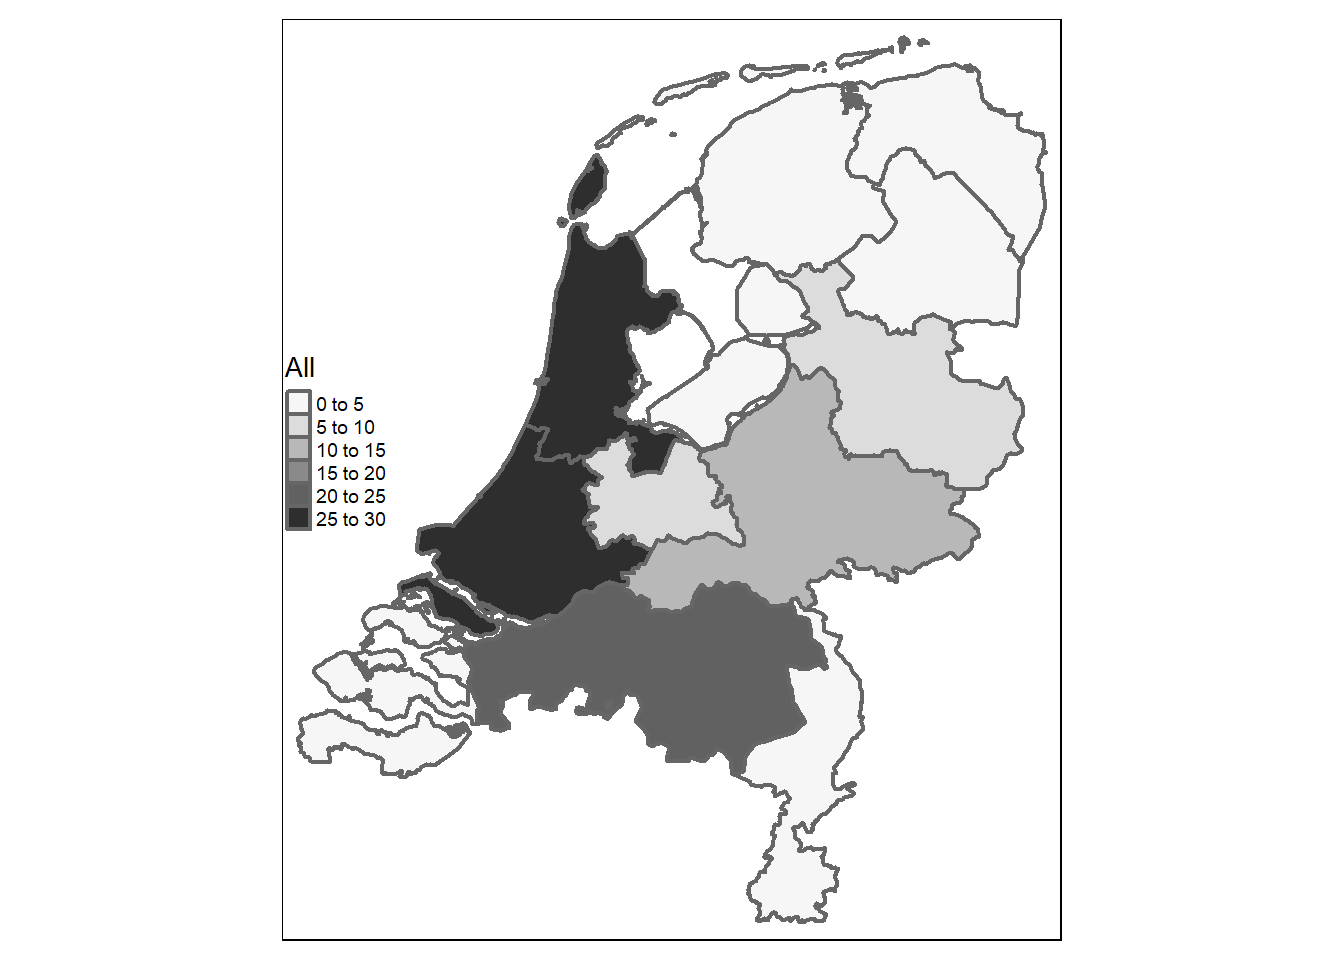
We can see that the provinces Noord-Holland, Zuid-Holland and Noord-Brabant are those associated with the highest numbers, with respectively \(25\), \(27\) and \(23\) medals, out of the total \(108\) medals. Now, let’s try to split the analysis and obtain different figures depending on the type of medal won by the athletes, namely whether they were gold, silver or bronze medals.
tm_shape(NLD_prov_medals) +
  tm_borders(lwd=2) +
  tm_fill(c("Gold"), palette = "Greys") +
  tm_layout(
    legend.title.size = 1,
    legend.text.size = 0.6,
    legend.position = c(0,0.44),
    legend.bg.alpha = 1)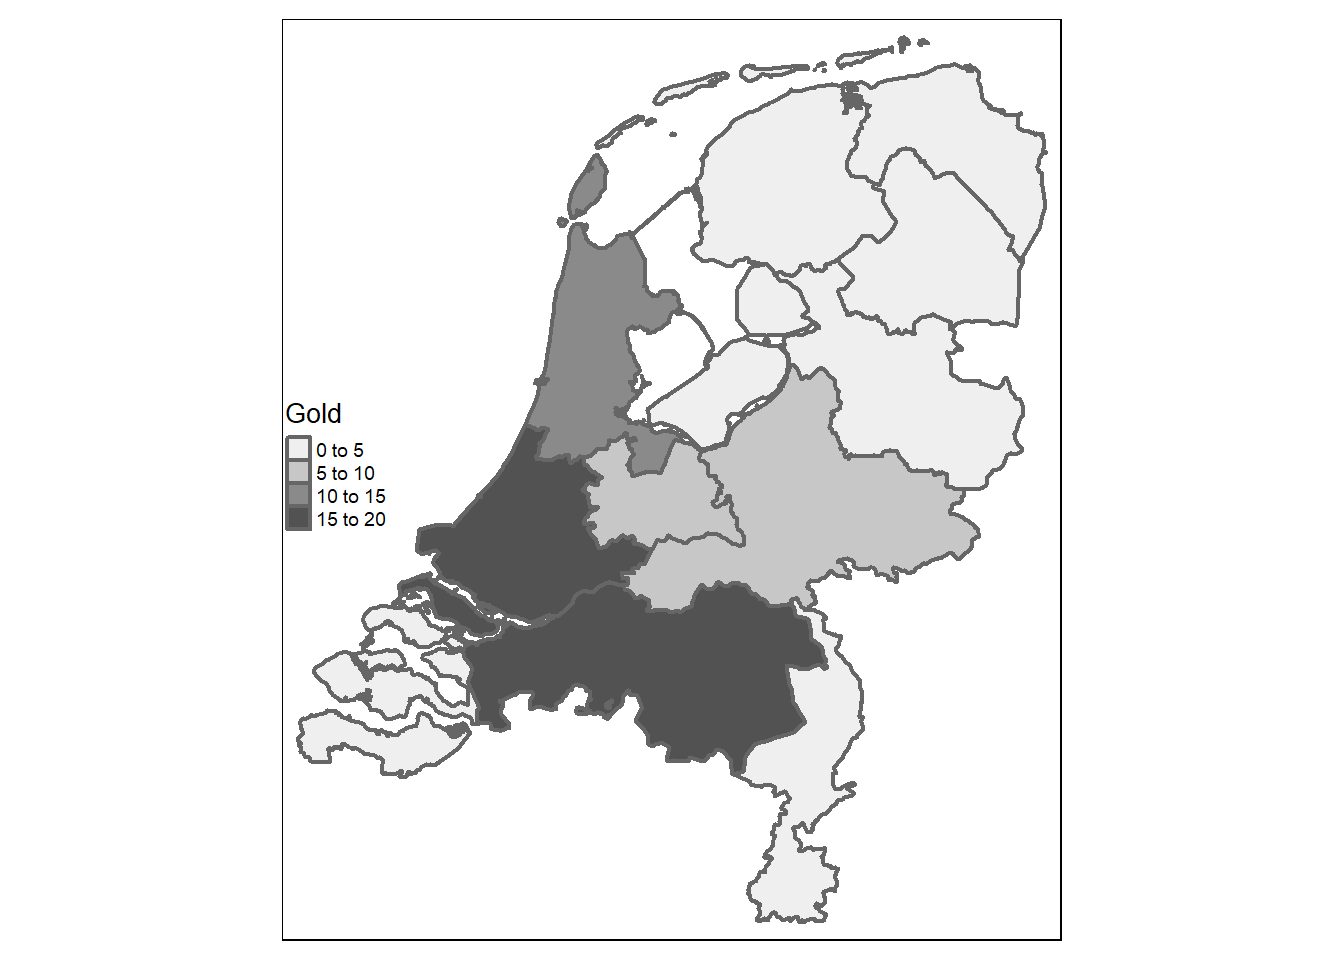
tm_shape(NLD_prov_medals) +
  tm_borders(lwd=2) +
  tm_fill(c("Silver"), palette = "Greys") +
  tm_layout(
    legend.title.size = 1,
    legend.text.size = 0.6,
    legend.position = c(0,0.44),
    legend.bg.alpha = 1)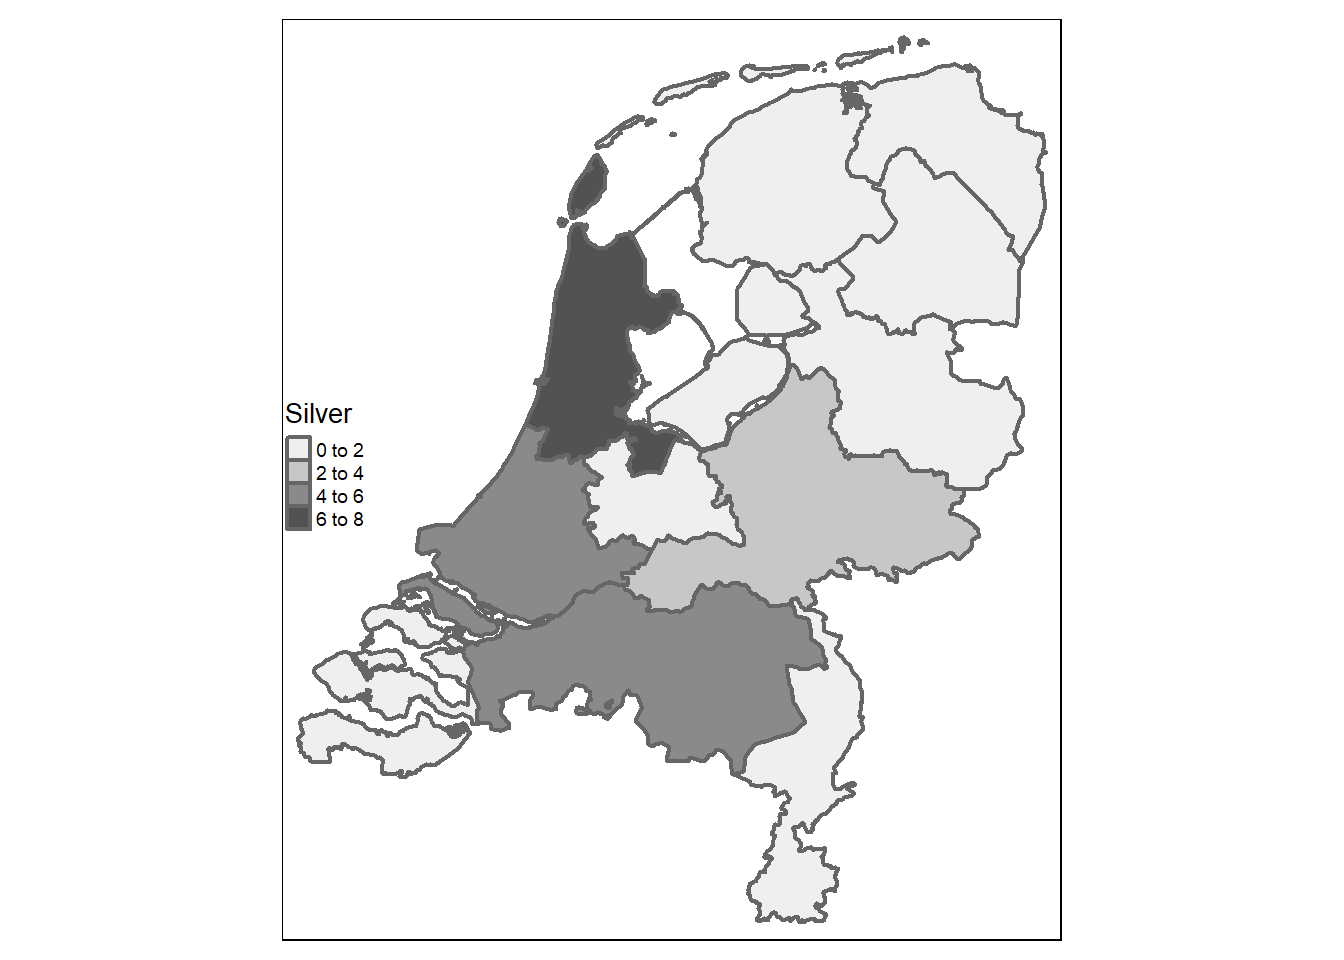
tm_shape(NLD_prov_medals) +
  tm_borders(lwd=2) +
  tm_fill(c("Bronze"), palette = "Greys") +
  tm_layout(
    legend.title.size = 1,
    legend.text.size = 0.6,
    legend.position = c(0,0.44),
    legend.bg.alpha = 1)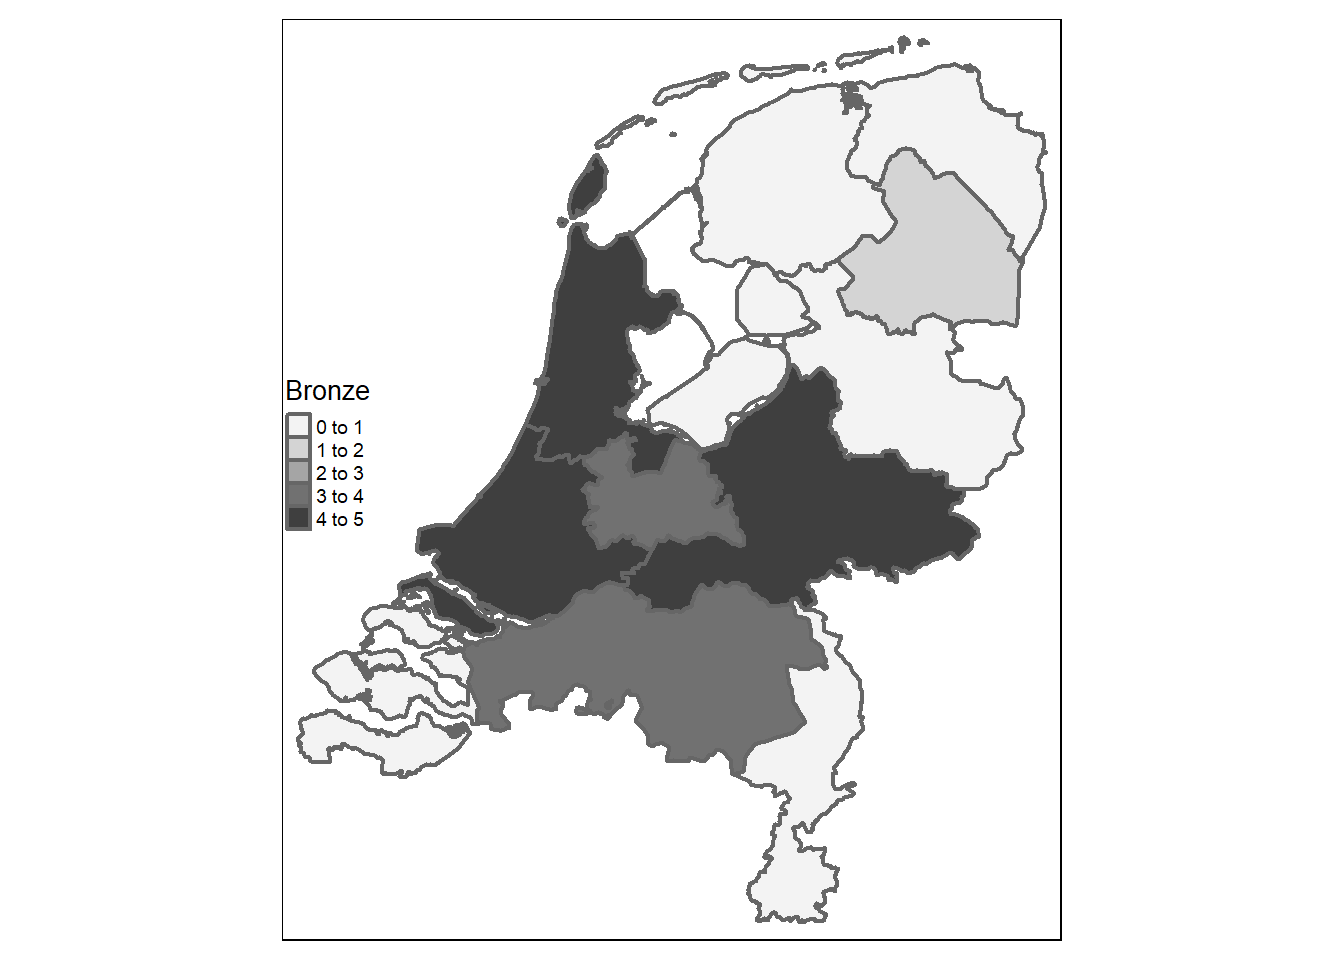
Stratifying the analysis by type of medal, we can see that:
At this point, we may also want to consider the fact that different provinces are associated with a different population density and birth rate which may be an important factor to consider when taking into account the number of medals won. To achieve this, I have obtained 2021 birth rate data from the Statistica website (\(%\) per \(1000\) people).
#add birth rate date by province (2021)
NLD_prov_medals$br2021 <- c(9,9.7,9,9.9,12,9.9,11.6,10.7,10.8,9.3,9.9,8.4)

tm_shape(NLD_prov_medals) +
  tm_borders(lwd=2) +
  tm_fill("br2021", palette = "Blues") +
  tm_layout(
    legend.title.size = 1,
    legend.text.size = 0.6,
    legend.position = c(0,0.44),
    legend.bg.alpha = 1)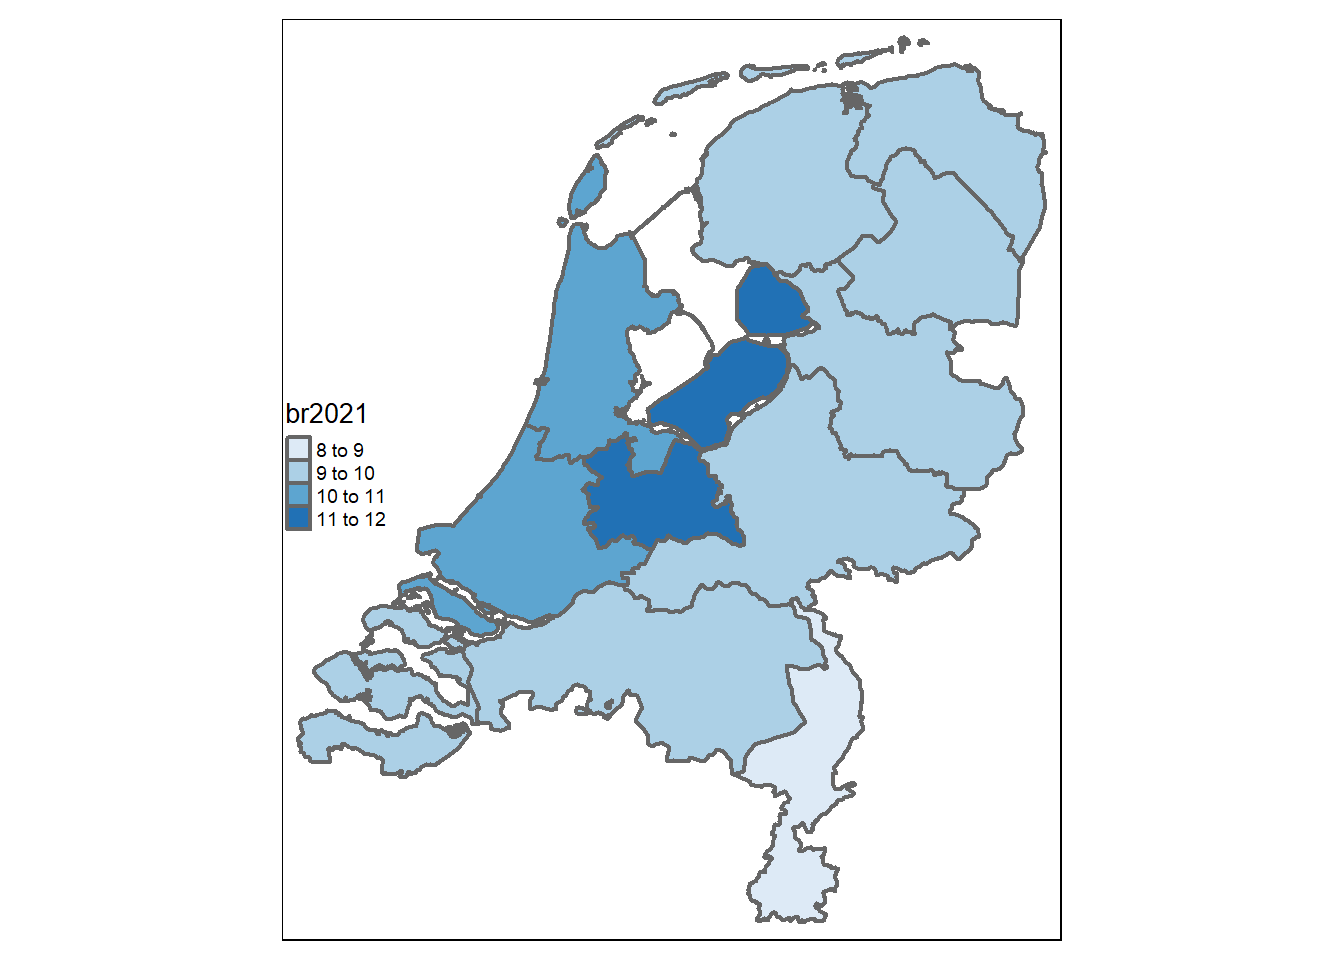
While using the population data already embedded in the dataset obtained via tmap, we can draw
tm_shape(NLD_prov_medals) +
  tm_borders(lwd=2) +
  tm_fill("population", palette = "Reds") +
  tm_layout(
    legend.title.size = 1,
    legend.text.size = 0.6,
    legend.position = c(0,0.74),
    legend.bg.alpha = 1)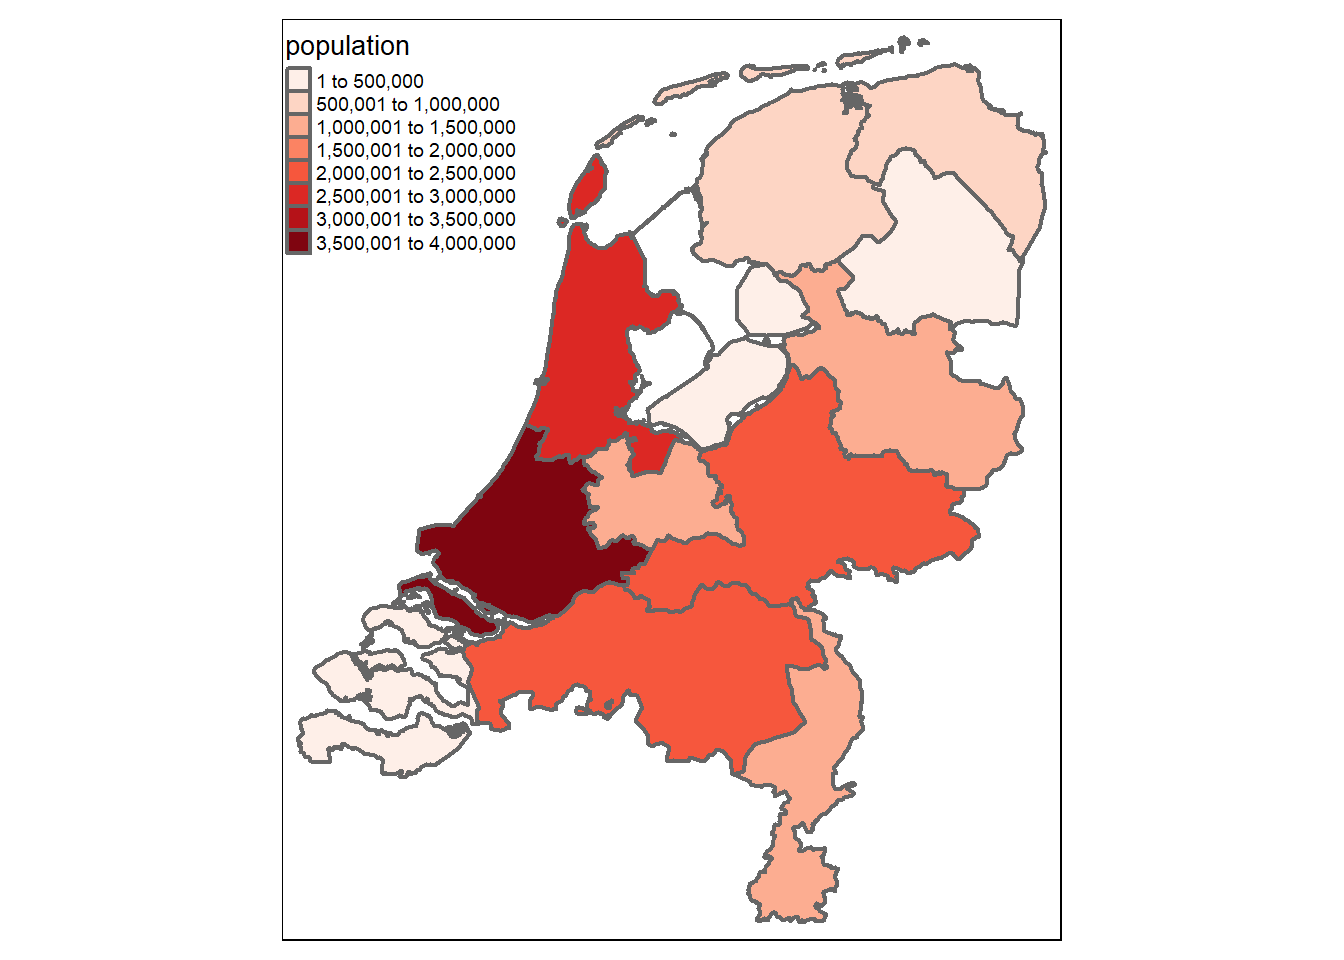
From these preliminary descriptive analyses we can see that, particularly in terms of population, both the Noord-Holland and Zuid-Holland provinces are associated with high numbers, therefore suggesting how the higher number of medals won by them may be potentially explained by the bigger number of people living within their borders compared to other provinces.
I hope you enjoyed a bit this little diversion from my usual posts as I really wanted to try out something different for once, which I found quite interesting. Well, see you next time then!